What you need from your CI
By Ladislav Prskavec (@abtris, ladislav.prskavec@oracle.com) on 30 Jan 2019
Apiary is using multiple Continuous Integration Engines (CIE). Our testing tool Dredd, for example, uses Travis CI to support multiple versions of Node.JS, and AppVeyor to support Windows. For a couple of projects we use Wercker which supports the Oracle Managed Kubernetes running our workload.
While our stack is based on Node.JS, we use many other languages including C++, Python, Ruby and Go. We use Git as our source control management. The Apiary team consists of about 25 engineers working across more than 100 projects. In this post I will focus on the biggest Apiary project, a big monolith app in Node.JS with external services using FaaS (AWS Lambda).
We started using CircleCI for our application in 2012. In 2015 we introduced parallelism for tests, initially with 2 nodes which we have since increased to 8. In 2016 we moved our testing to Docker to improve the isolation. Since 2017 we have been using CircleCI 2.0 (docker native).
What do you need from your CIE?
In my point of view, these are the most important features of a CIE:
- Speed
- Reliability
- Scalability
- Maintenance costs
1. Speed
Firstly let me ask this: do you ever think about your builds? Try answering these questions:
- Do you know your time to deploy?
- Do you know how much time is spent in queue?
- What is the maximum acceptable time for your build (5, 15, 30 min, 4h)?
- Do you monitor those times or are you just guessing?
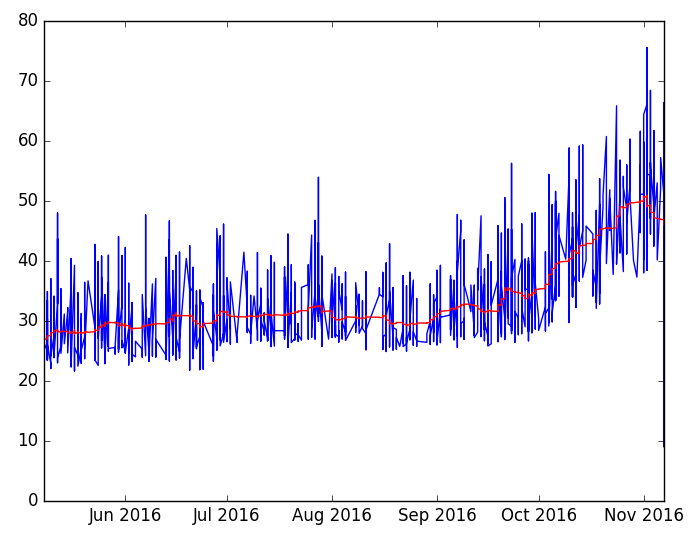
In 2016 we had problems with the speed of our test suite. As you can see on the graph below, our tests in that year took 28 min in May and ended up taking up to 50 min in November. This caused multiple problems and affected the team morale. People started ignoring flaky tests and running more retries. The time to deploy was horrible and we couldn’t deploy new features as fast as we built them.
We launched an engineering project to solve the problem of the long time it took to deploy. We started with these main points:
- Awareness
- Groups
- Parallelism
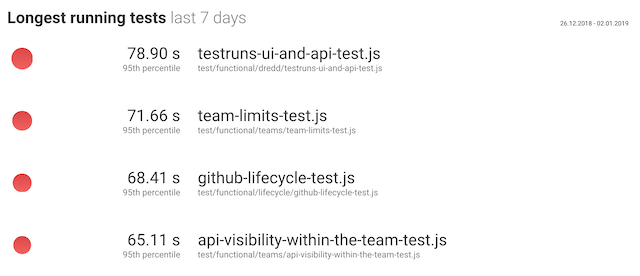
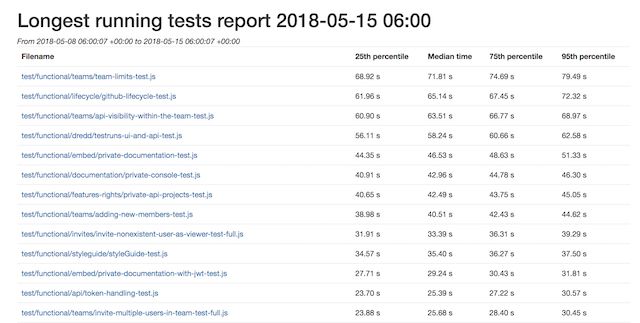
We looked for easy ways to improve the results. We invested more money and divided the test suite to run in parallel containers, going from 4 to 8 containers per single build and eventually ended up using 33 containers in CircleCI (enabling 4 parallel builds of the monolith). We created our own tooling called Testmon that can trigger builds running during the night, collect metrics from those builds, and produce reports which we display in the office to increase visibility of problematic tests. All metrics are pushed into our monitoring, and using PagerDuty we have set up alerting on possible problems, as well as creating incidents to make sure those issues are resolved.
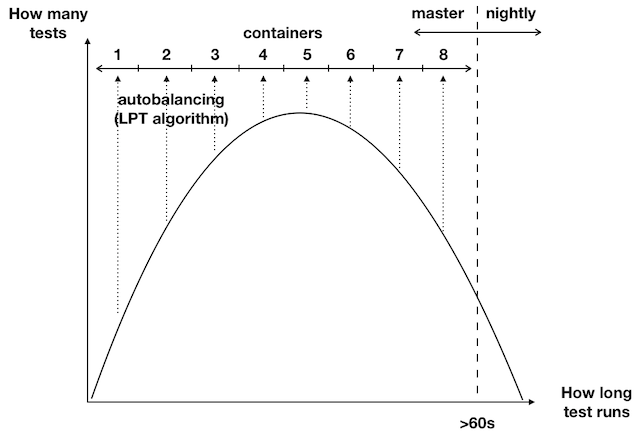
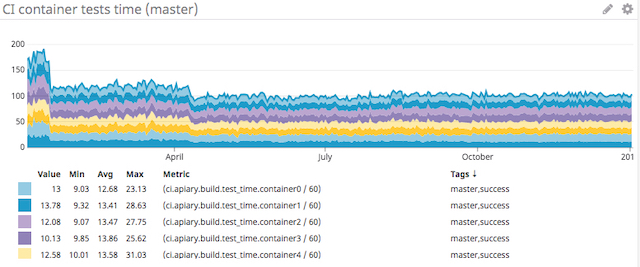
On the graph below you can see how we split the tests into groups. We moved the longest running tests and the least frequently changing parts into nightly builds. We ended up splitting the master test suite into 8 containers. We used Testmon for autobalancing, because every day it calculates the test suite configuration using the LPT algorithm.
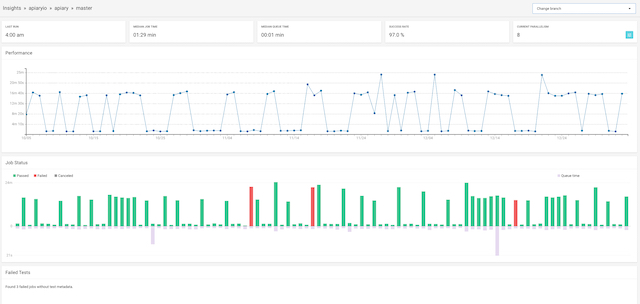
CircleCI does have its own metrics called Insights. They aren’t very helpful for making decisions, because you can only see the build times for the past 3 months, and it’s impossible to see the details or modify them for your specific use case.
That is why we are using Testmon to collect these metrics:
ci.<APP_NAME>.overall_time- Duration of the whole CI run since submissionci.<APP_NAME>.build_time- Duration of the job runci.<APP_NAME>.queue_time- How long this job was queued for before the runci.<APP_NAME>.cumulative_time- The sum of all containers’build_timeci.<APP_NAME>.cumulative_test_time- The sum of the running times of all testsci.<APP_NAME>.build_time.containerX-build_timeon container Xci.<APP_NAME>.test_time.containerX- test running times on container X<APP_NAME>.eslint_errors- linting errors
and tags:
- success
- failed
- canceled
- timedout
- infrastructure_fail
- retry
- master
All times are in seconds unless stated otherwise.
We get the data from out tests using a test reporter in junit format.
Testmon uses junit data with metrics to create dashboards as seen on the next screenshot:
and to generate full reports, too:
2. Reliability
As explained in the previous section, in 2016 we had problems with tests running for way too long. But another issue with our test suite was its reliability - we had many flaky tests. Not being able to depend on the tests had a horrible impact on the team. We noticed that the engineers developed notification fatigue to tests which failed randomly. Instead on fixing the problems, people would instead rerun the tests and hope they would pass on the retry.
To solve the reliability problem we used a similar approach to long running tests. We focused on:
- Detection of flaky tests (2 builds with 1 git hash)
- Awareness (dashboards, metrics)
- Procedure
- Consistency
We created a report showing flaky tests. That helped increase awareness, but the main focus was on changing the approach to the problem whatsoever.
We changed the procedure for managing the tests and we started by focusing on the responsibility. Every test and helper needed to be clearly assigned to a particular team which could be consulted if any issue occured. As a second step we adjusted the maintenance - now that there was a team responsible for every test, flaky and long running tests could and should be a part of the regular sprint work.
From our experience there is a very big difference between a build time and cumulative time, as you can see on this screenshot:
I think that is caused by shared hardware used in CircleCI. We are currently working with Wercker to be able to use our Oracle Container Native Services instead.
3. Scalability
Are you thinking about your scalability? Try answering these questions:
- How long are your people waiting for CI results?
- Can you run your tests in parallel?
- Can you add 10 developers into the team and time to deploy will stay the same?
- How much does your build infrastructure cost?
- Do you have budget for build/test infrastructure?
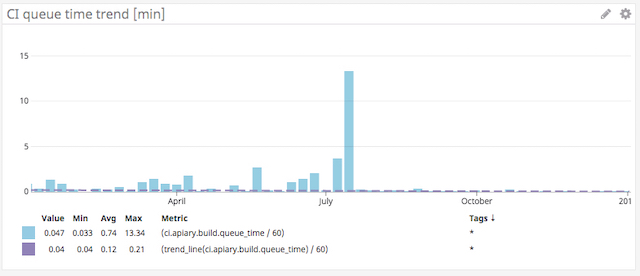
We are always looking at a problem from the perspective of adding more people into team, and the impact on their work. You can see from the screenshot below that the waiting time in a queue is minimal, increasing only in some parts of the year.
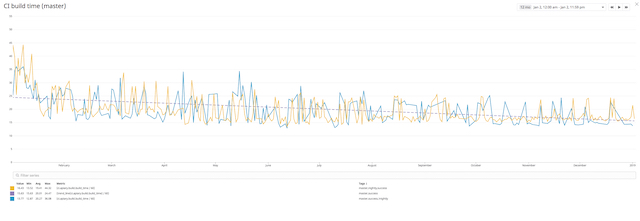
We focus on being able to deliver as fast and safely as possible. You can see that in the past year we had a good trend and the average time was stable or decreasing.
4. Maintenance costs
The fourth important thing is the cost. I’m focusing on the operations costs, and don’t calculate costs for tests maintenance as those are included in development itself.
Your costs are different depending on the type of your CIE:
- SaaS (Circle, flat fee: $50 per container, dedicated support)
- On-Premise (Jenkins master + workers)
- Hybrid (Wercker, use managed K8S cluster for workers)
- Combinations (JenkinsX, Gitlab, …)
The benefit of using SaaS solution is a flat price, which works very well for startups. If you get free credit from the cloud provider you can spare money using a hybrid solution to combine credits for running instances.
Summary
Every team has a different approach to CIE problems and we are lucky to have many tools to choose from. At Apiary, we always prefer Travis CI for open-source. AppVeyor allows us to support Windows users, which was a significant problem in years before that CIE for OSS projects launched.
We’ve also been very satisfied with CircleCI, and if we will migrate to another solution to be more consistent with other Oracle teams, we will maintain the current approach and try monitoring everything important to us. Getting data is critical, so don’t hesitate to add CIE metrics to your production monitoring. If something doesn’t work on your CIE, it can be treated as an incident in the same way the production issues are.

